

2026.10.13
SigNoz: Putting Logs, Metrics, and Traces on One OpenTelemetry Platform
SigNoz targets teams seeking a unified view of application and infrastructure telemetry, with self-hosting, APM, logs, metrics, tracing, and AI observability. Operations, capacity, and licensing still need review.
What it does
SigNoz is an open-source observability platform built on OpenTelemetry. Its stated purpose is to place logs, metrics, distributed traces, alerts, exceptions, and dashboards in one location. For teams already using OpenTelemetry, or those looking to reduce switching among single-purpose observability tools, it can be a common investigation surface.
It is not presented merely as a trace viewer. The README lists APM, log management, metrics and dashboards, infrastructure monitoring, distributed tracing, and Trace Funnels. APM covers latency, error rate, throughput, Apdex, endpoints, database calls, and external calls. Logs can be ingested, searched, and aggregated, then correlated with traces and metrics. Metric exploration lists Query Builder, PromQL, and ClickHouse SQL.
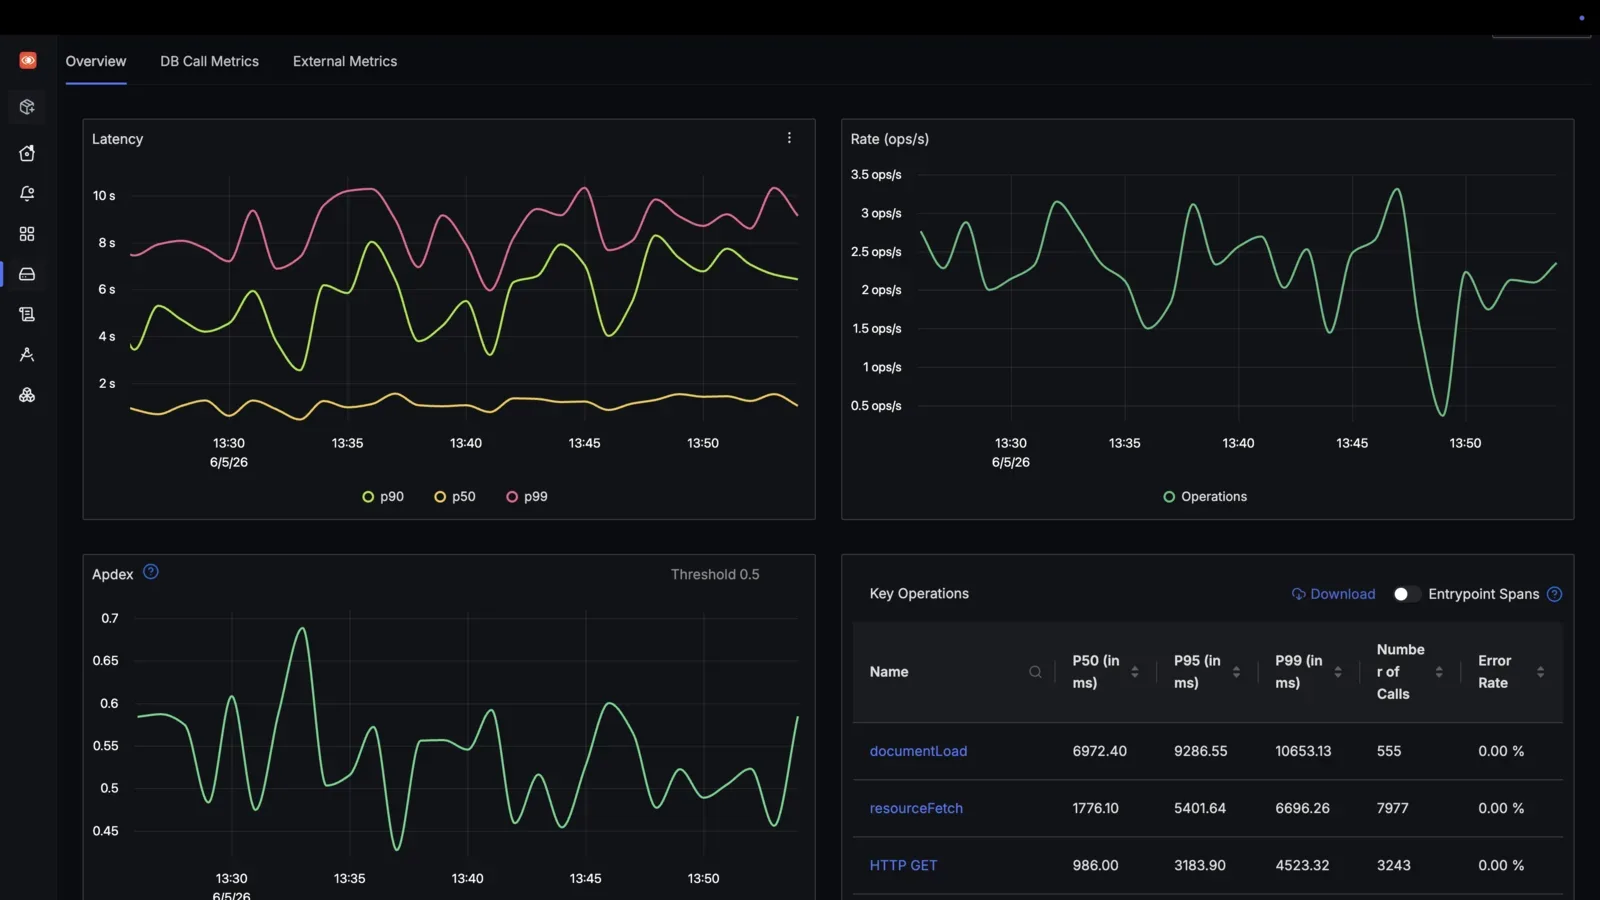
Image source: signoz. Published by the project; the interface may vary by version.
Who it may suit
SigNoz may suit developers, platform engineers, and SRE teams responsible for diagnosing production systems. It is also relevant to organizations seeking to view Kubernetes, host, and application telemetry together. Teams operating LLM applications or RAG pipelines can use the documented capabilities to inspect prompts, tool calls, tokens, latency, and costs.
The Community edition runs in an organization’s own infrastructure. The README lists Docker, Kubernetes, and Linux as deployment paths. Organizations that have already established OpenTelemetry collection or instrumentation should still verify how their existing telemetry will be ingested.
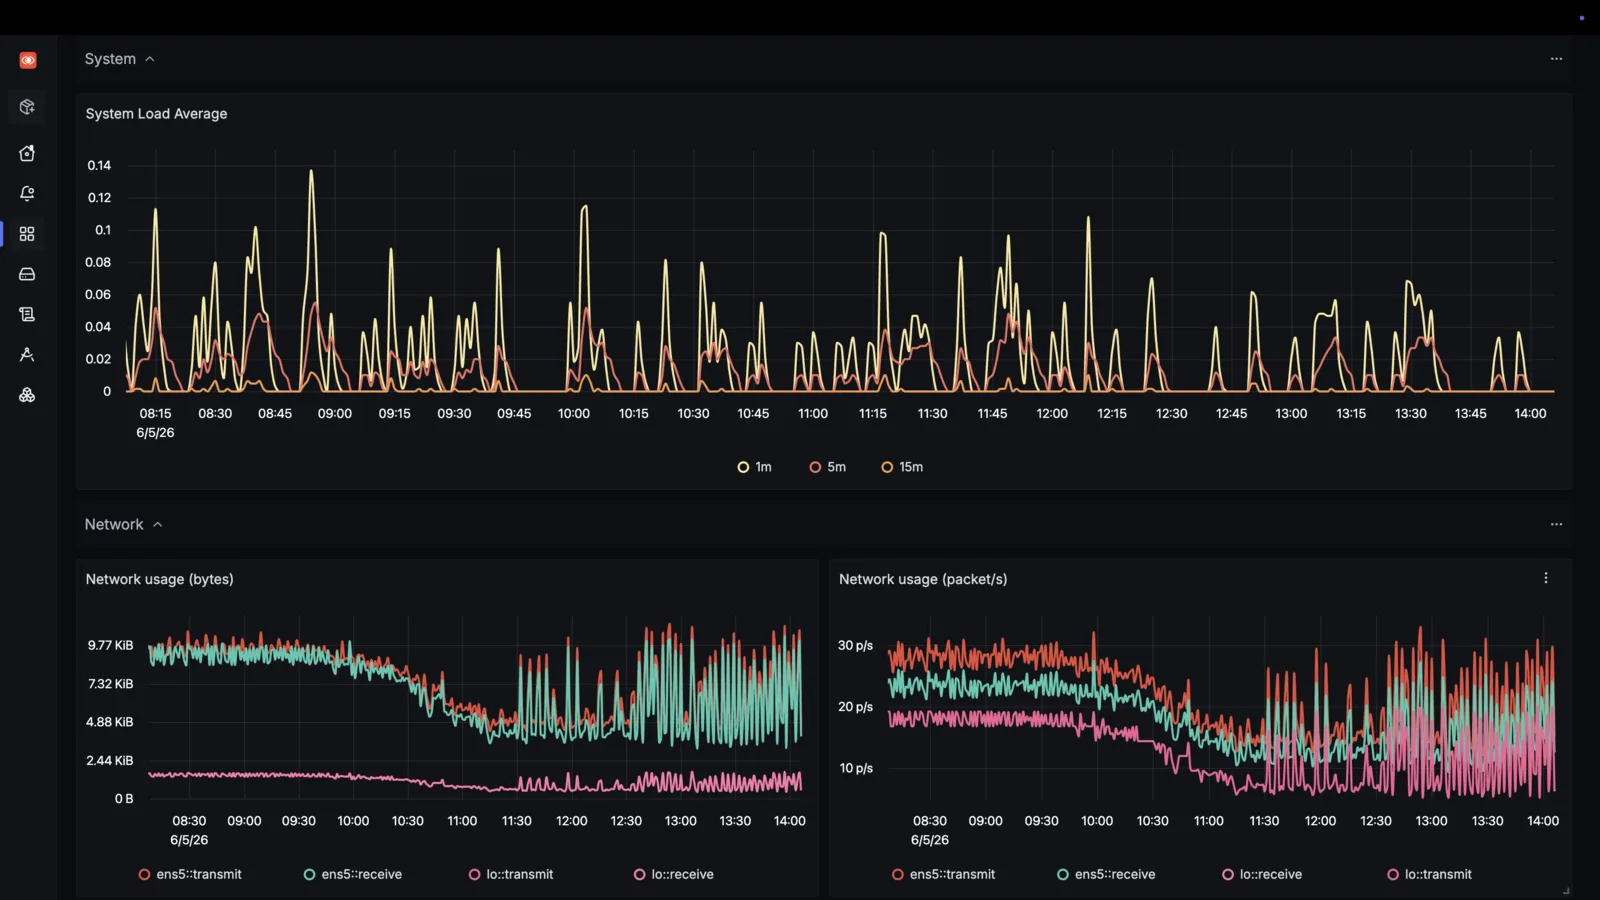
Image source: signoz. Published by the project; the interface may vary by version.
Documented capabilities and version information
For distributed tracing, SigNoz documents flamegraphs, waterfalls, span events, filters, and trace analytics. Trace Funnels are intended to expose request-flow drop-offs, failed transitions, and systemic workflow issues. SigNoz also provides an MCP Server for bringing telemetry into coding agents. The README explicitly states, however, that Noz in SigNoz Cloud is available only in the cloud service.
The official v0.145.0 release notes mention a JSON body dual-ingestion flag, semantic-convention handling across logs and metrics, and actions to create alerts and add them to dashboards from Explorer views. The release also lists fixes related to authorization and assistant-message retries. Teams should compare those notes with their existing configuration before an upgrade.
Limits and deployment considerations
Self-hosting means the operating team must plan installation, upgrades, storage, backups, network access, and telemetry retention. The supplied sources do not confirm minimum hardware, capacity formulas, or performance guarantees. Resource planning should therefore consider expected log volume, metric cardinality, trace sampling, and query patterns rather than assume a baseline.
Licensing requires separate verification. The repository API reports the license name as “Other” and the SPDX identifier as “NOASSERTION”; the supplied sources do not establish a specific license. The README also lists Enterprise, BYOC, and Enterprise Self-Hosted options, mentioning compliance, RBAC, data residency, support, and custom retention. Their exact scope and commercial terms need confirmation from the project provider. Before deployment, teams should also validate ingestion paths for OpenTelemetry, Prometheus, Kubernetes, databases, and target LLM tools, while defining handling boundaries for sensitive logs, prompts, and token-related data.
Sources
Sources checked: 2026-10-13